The smartest surfers know when it’s time to leave the water — even when the waves are still looking good.
But surfers are a cliquish bunch. The old hands surfing their home reef don’t bother to tell occasional visitors like me when it’s time to get out of the water. Learn the hard way, they say.
The same is true for the stock market. Sometimes the market is full of fellow investors. Other times, before you know it, you’re all alone out there.
That’s not a place you want to be.
History shows that when large institutional investors exit the equity market, leaving behind a smaller pool of retail investors, it means a correction is coming.
And that’s exactly what we’re seeing this summer.
A useful way to visualize the relationship between trading volume and market direction is an indicator called “On Balance Volume” (OBV).
OBV is a running total of trading volume, adding the volume of trades when a day closes higher, and subtracting the volume of trades when it closes lower. It’s a quick way to see if volume is increasing in the trending direction.
Declining volume during an uptrend indicates that interest is decreasing. If an asset’s price is rising but OBV is falling, it means that the uptrend may be in trouble. This is because down days are seeing more volume than up days, thus pushing OBV lower.
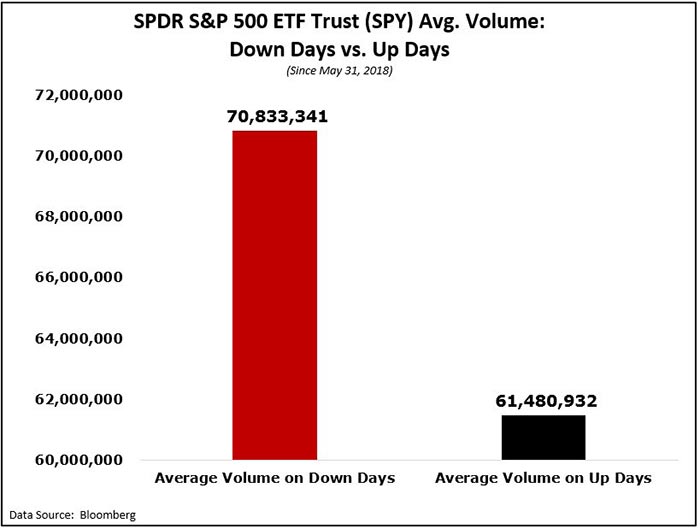
That’s exactly what we’ve been seeing since the end of May. The biggest trading days by volume have all been down days. The average volume of down days is significantly higher than up days:

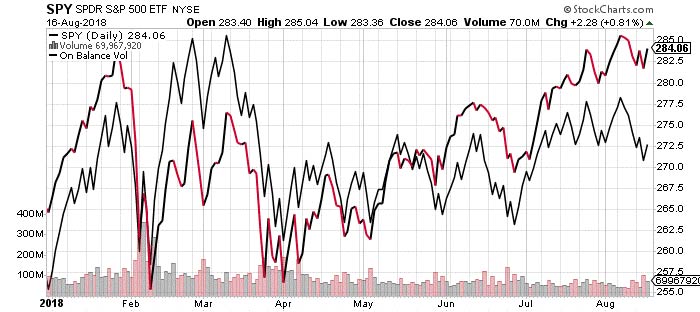
Consequently, OBV has been stagnating relative to the overall market index. The last time OBD trended consistently lower than the market index was just before the big crash at the beginning of February:

2 Sides to Every Trade
We often hear talk about the “breadth” of a bull market.
Indicators of market breadth include the percentage of firms of which stock prices are rising, or the proportion of a market index’s rise accounted for by the given number of firms with higher-than-average price appreciation.
Depending on how you spin these numbers, you can make it appear that the market is healthier than it actually is. That’s because supply-side indicators of market breadth neglect the demand side — how many people are buying stocks, and who are they?
There is ample evidence that large investors such as mutual funds, pension funds and other institutional investors have been net sellers during 2018. The same is true of foreign buyers of U.S. stocks.
The investors who are left in the market — like the surfers still in the backline as the sharks start to come out — are small retail investors like you and me.
What Makes Smart Money Smart?
Why would large institutional investors go home if the market is still rising? For the same reason experienced surfers leave the water at dusk: You could still have fun, but increasing risk means it isn’t worth it.
I can’t say whether it’s time to pull your investments out of the stock market. Certainly, there are many equities and other assets that are worth holding onto regardless of any future dip.
But it’s worth taking the advice I saw in a recent headline to heart: Stay at the party … just stay near the door.


